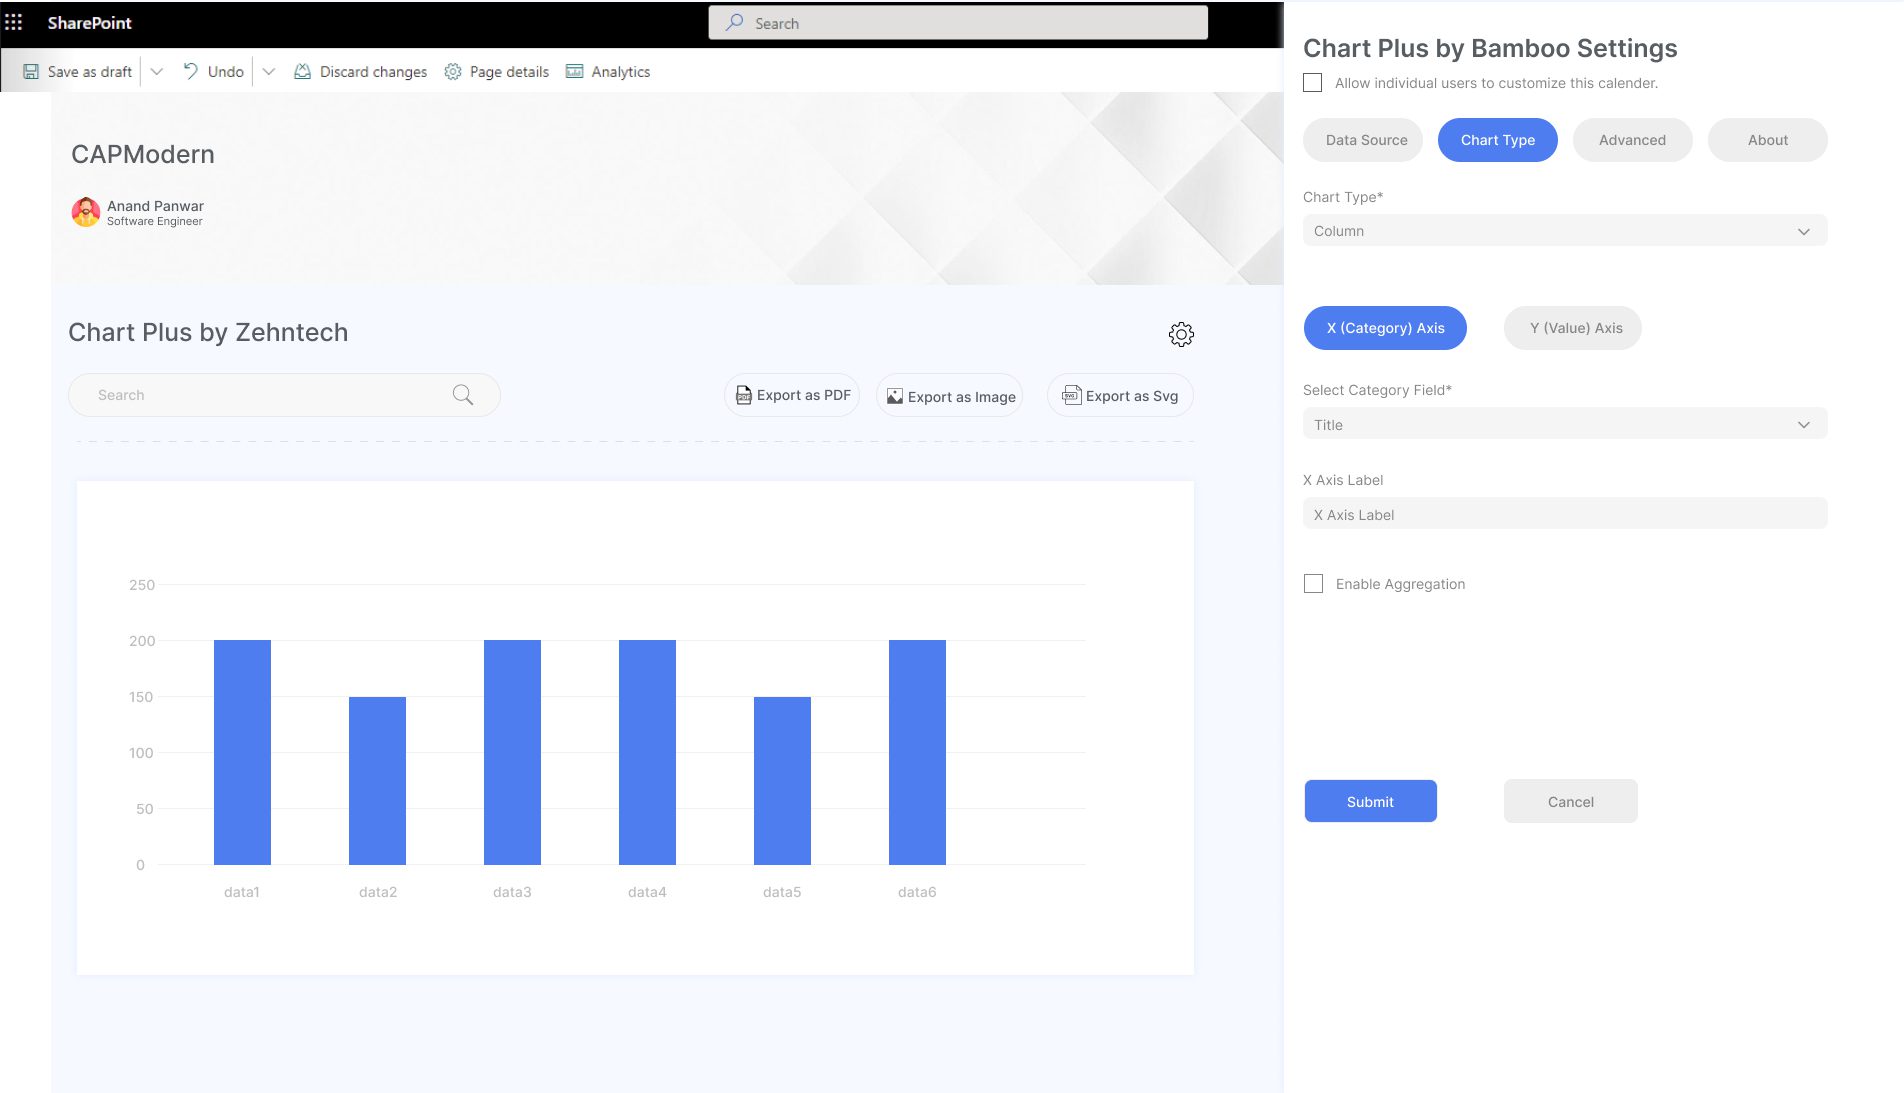
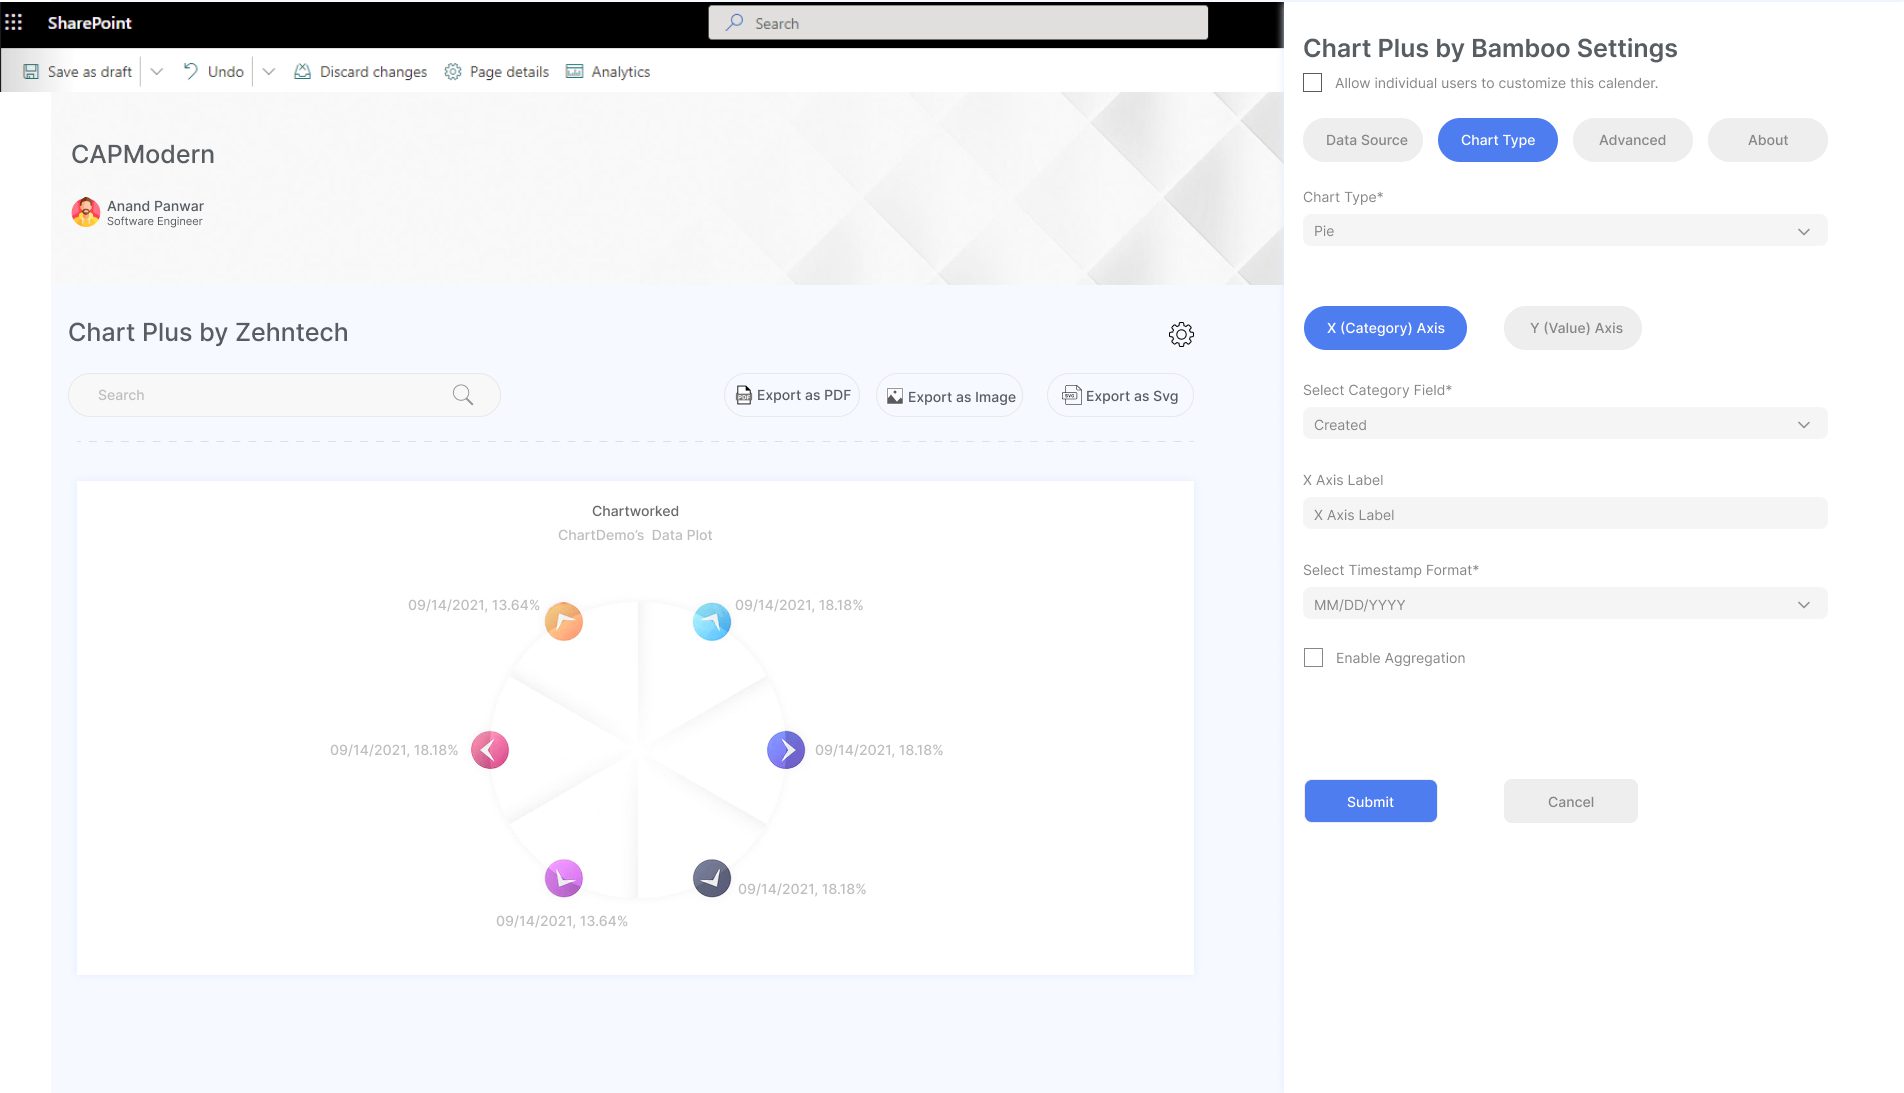
Provide a visually attractive and self-explanatory view of your data with Infographer. It allows you to easily add visually dynamic charts and graphs to your SharePoint sites. One does not need to learn coding or BI tools for these chart creation and other edits in fewer steps you can create charts from your SharePoint data sources. This will enhance your power of decision-making by replacing it with a more strategic one by providing real-time insights from your data points. Sharing this crucial information with ease through PDFs or images makes collaboration and interaction smooth and effective. You can conveniently highlight data sources or view informative tooltips by hovering over graphs. Runtime filtering is enabled by selectable legends, so you can hide or highlight certain elements or chart types. You are also empowered to view real-time configuration changes in a chart web part.
Duration
150 Days
Release date
Jan 2022
Working Hours
1200 Hours
Duration
150 Days
Release date
Jan 2022
Working Hours
1200 Hours
The demand was a no-code webpart that supports the creation of charts, their customization, visualization, and export within a minimal time period. The web part was expected to bring in a greater change in the organization’s results by improved decision-making through real-time insights from data points. It must be technically designed to Visualize trends helping to analyze relational stats with clarity.
The webpart is designed to provide the freedom to create charts from your SharePoint data sources in no time with no need for scripting or using BI tools. The webpart has the main feature of executing an interactive chart which can be prepared out of 8 interactive options – including scatter plot, donut graph, pie chart, and line graph. The configuration is easy and quick with no requirement of knowledge related to coding or learning curves or teaching yourself complicated BI tools. The advanced web part provides the capability to Aggregate your data section with sums, average, min, max, or count using X and Y axis options.
Features inculcated with the webpart are:
1. It supports developing effective reports and combining and group statistics.
2. The webpart allows printing or exporting charts in PDF and other formats to add to presentations or to send via email.
3. It facilitates cooperation in an increased and effective manner through charts that can be displayed on multiple devices.
4. It enables the user to create charts in a few simple steps without having any knowledge of coding or BI tools.
5. The webpart allows functions by quickly highlighting statistics or to get helpful tooltips by simply hovering over the charts.
The esteem SharePoint team at Zehntech spent hours on this project amazing the client with the web part we delivered. The project was a huge success due to the enhanced visualization services it provided without asking for coding or other tool knowledge or expertise. The web part provided huge support to the client in decision making by the insights it served in a format that was quick to grab and understand. We blended client’s requirements with our tech expertise to bring into existence a web part that supports Modern sites for SharePoint Online/Microsoft 365.
Our team of certified engineers and tech enthusiasts is keen to help you securely & efficiently take your business to the next level.
G01 – G02, New IT Building Left Wing, 142 –A
Electronic Complex Pardeshipura, Indore (MP), 452010
Zehntech Europe, Bolderweg 2,
1332 AT Almere, The Netherlands
1968 S. Coast Hwy #794,
LagunaBeach CA 92651, USA
Start Conversation
Connect to Our Sales Team
Connect to Our HR Team
© 2025 Zehntech Technologies Pvt. Ltd. All Rights Reserved.
You have successfully subscribed to the newsletter
There was an error while trying to send your request. Please try again.
Keep an eye on your inbox for the PDF, it's on its way!
If you don't see it in your inbox, don't forget to give your junk folder a quick peek. Just in case.